
Surface Temperature of Offenbach from Landsat Satellite Data
Published:
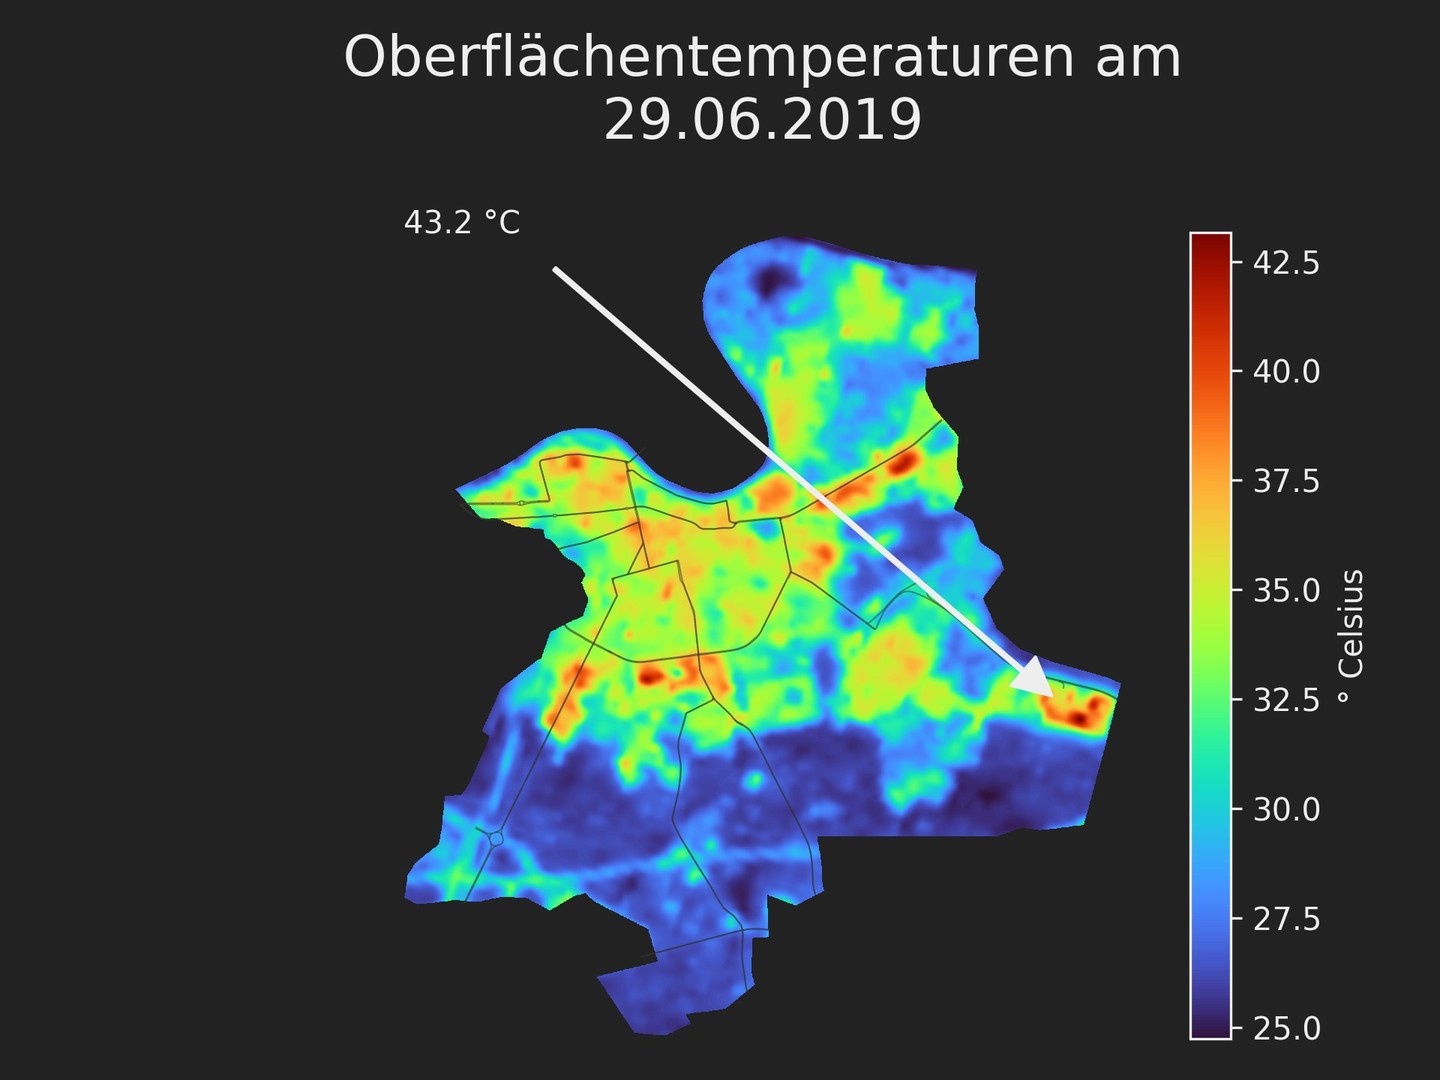
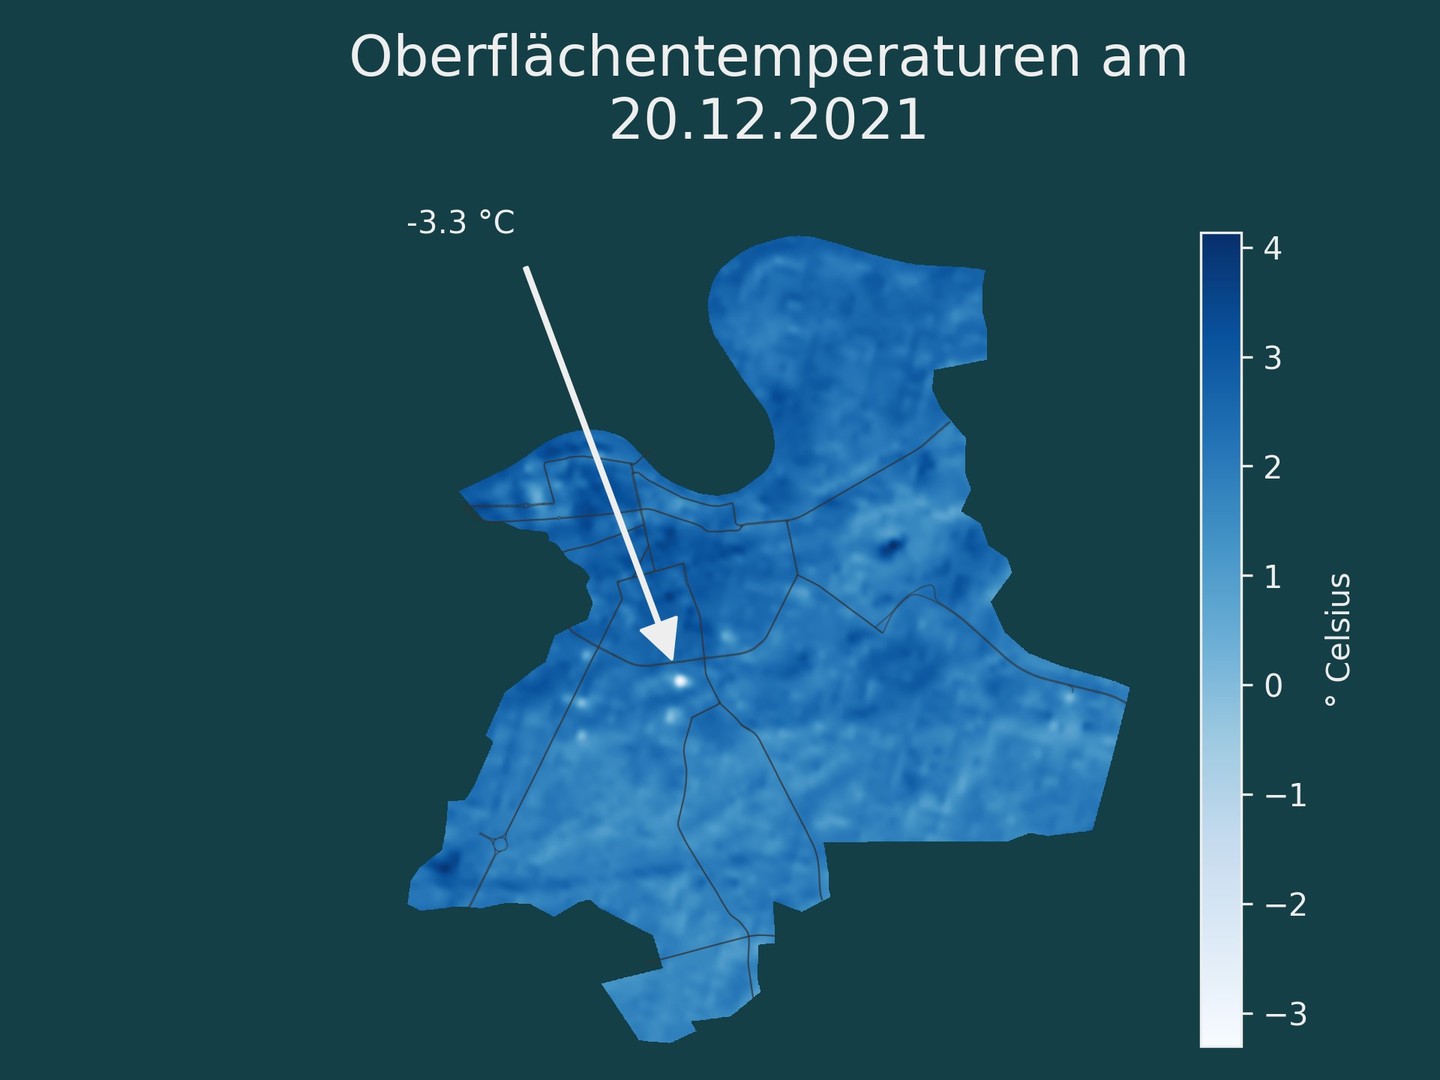
Surface temperature maps of Offenbach derived from Landsat satellite imagery between 2017 and 2022. The first image shows the highest recorded temperature in that period (in the Waldhof industrial area). The second shows the lowest – the roof of a company specializing in cooling and climate technology. Make of that what you will.
How it works
Landsat satellites capture multispectral imagery including shortwave infrared. Band 11 provides surface temperature readings in Celsius. The resolution is 30m x 30m per pixel.
The analysis uses the ArcGIS Multispectral Landsat Imagery Layer, filtered for cloud cover below 5%:
class RemoteSensing:
    def get_sat_images(self):
        self.get_landsat()
        self.get_city_geometry()
        self.get_city_area()

        selected = self._landsat.filter_by(
            where=f"(Category = 1) AND (cloudcover<={MAX_CLOUD_COVER})",
            time=[START_DATE, END_DATE],
            geometry=arcgis.geometry.filters.intersects(self._city_area['extent'])
        )

        for img_id in sat_image_ids:
            img = self._landsat.filter_by('OBJECTID=' + str(img_id))
            normal = apply(img, 'Band 11 Surface Temperature in Celsius')
            normal = clip(normal, self._city_geometry)
            normal.export_image(...)
Each exported raster is then overlaid with OSM building footprints and the road network for context. The annotation arrow points to the pixel with the extreme value.
Takeaway: when it gets hot, head to the Main or into the forest.