
70 Years of Temperature Data in Offenbach
Published:
Almost 70 years of temperature data from Offenbach (1957–2025), based on over 20,000 daily measurements from the German Weather Service (DWD).
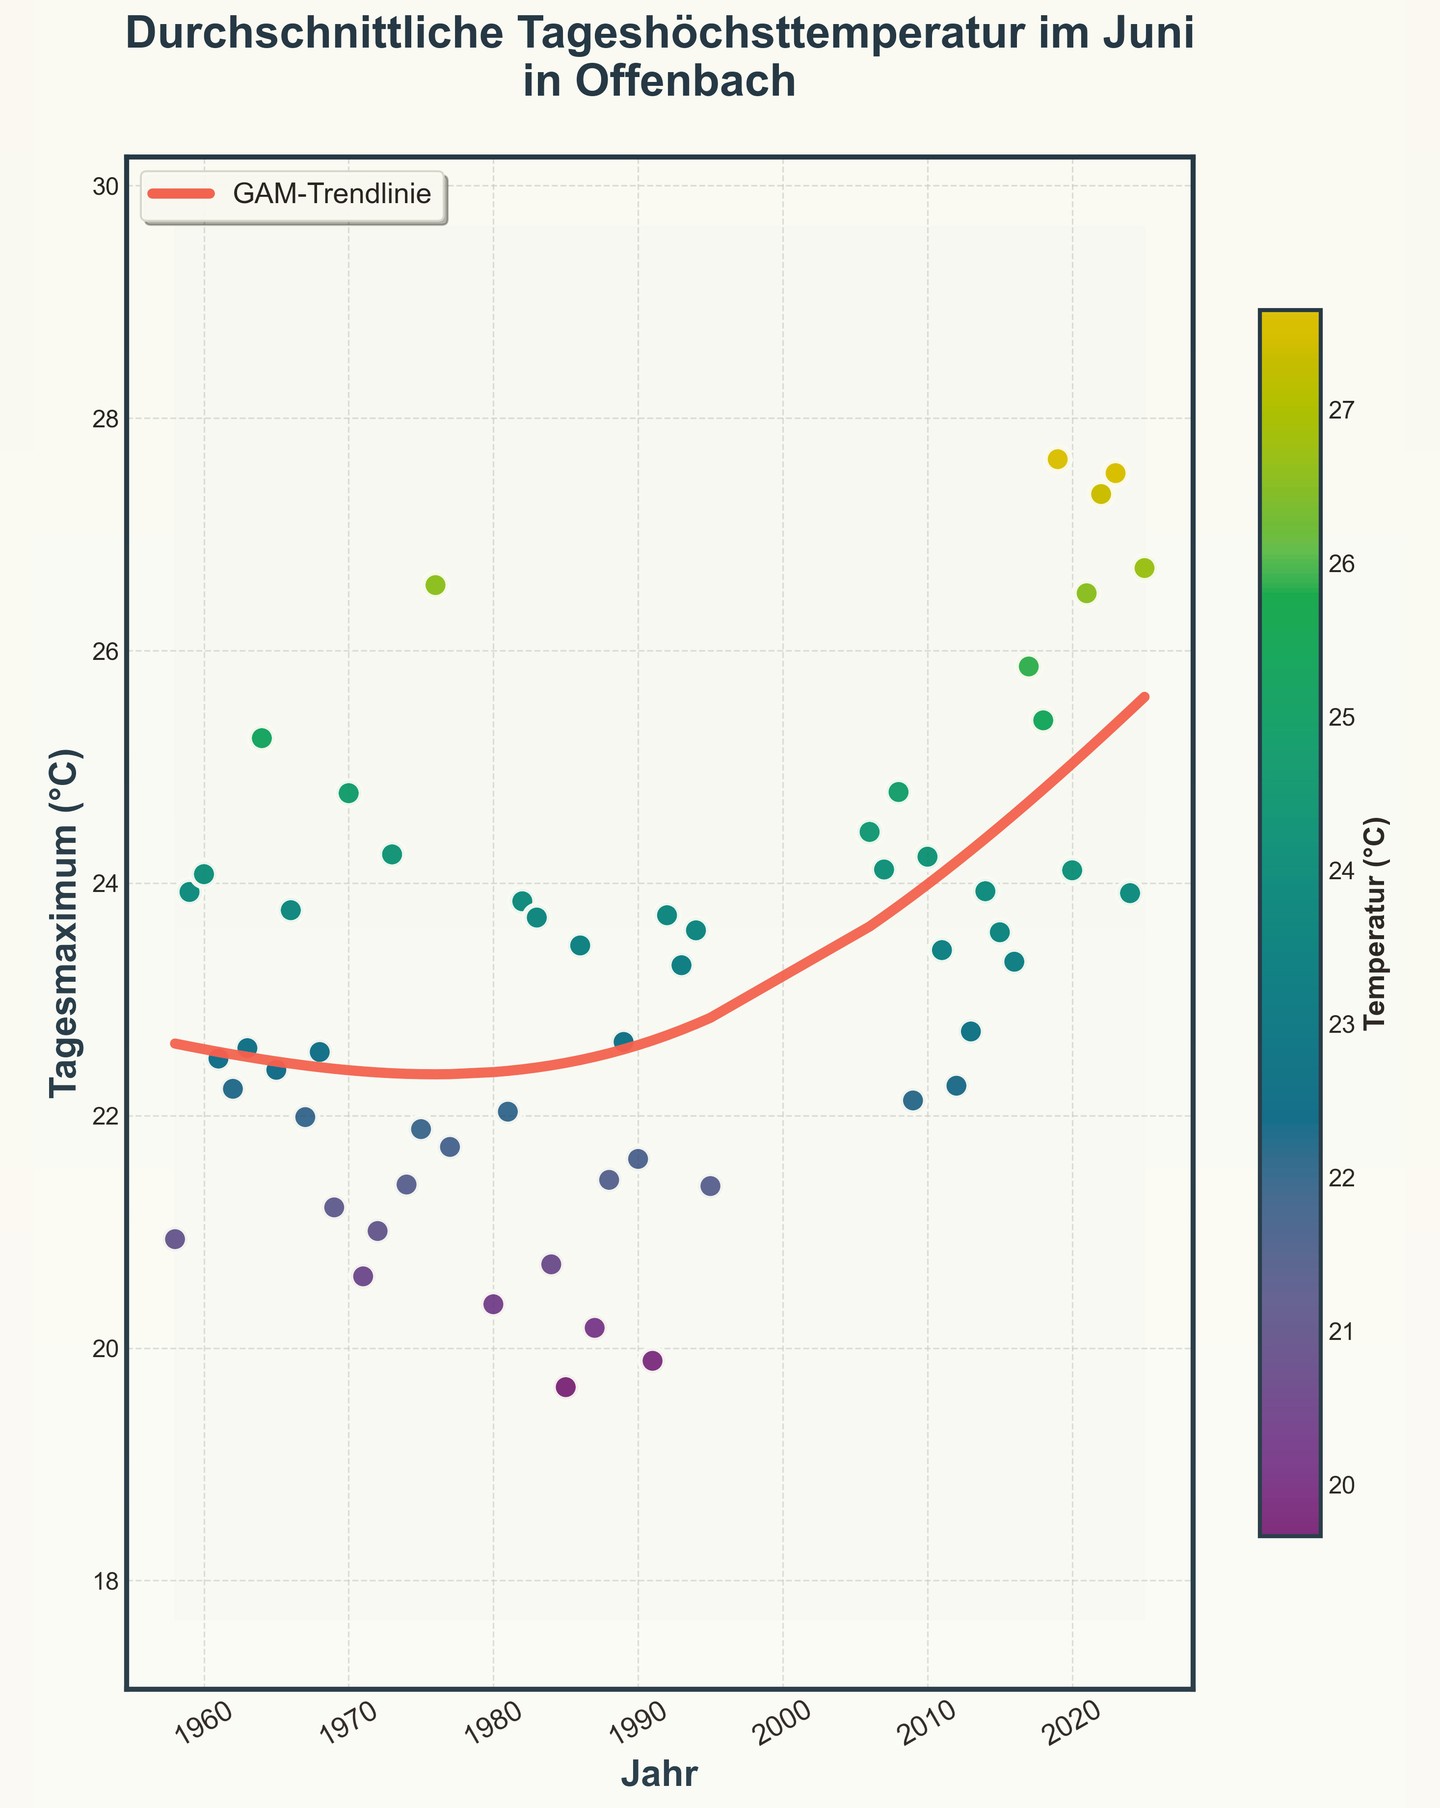
The first chart shows average daily maximum temperature in June. The GAM trend line confirms what you’d expect: it’s getting warmer.
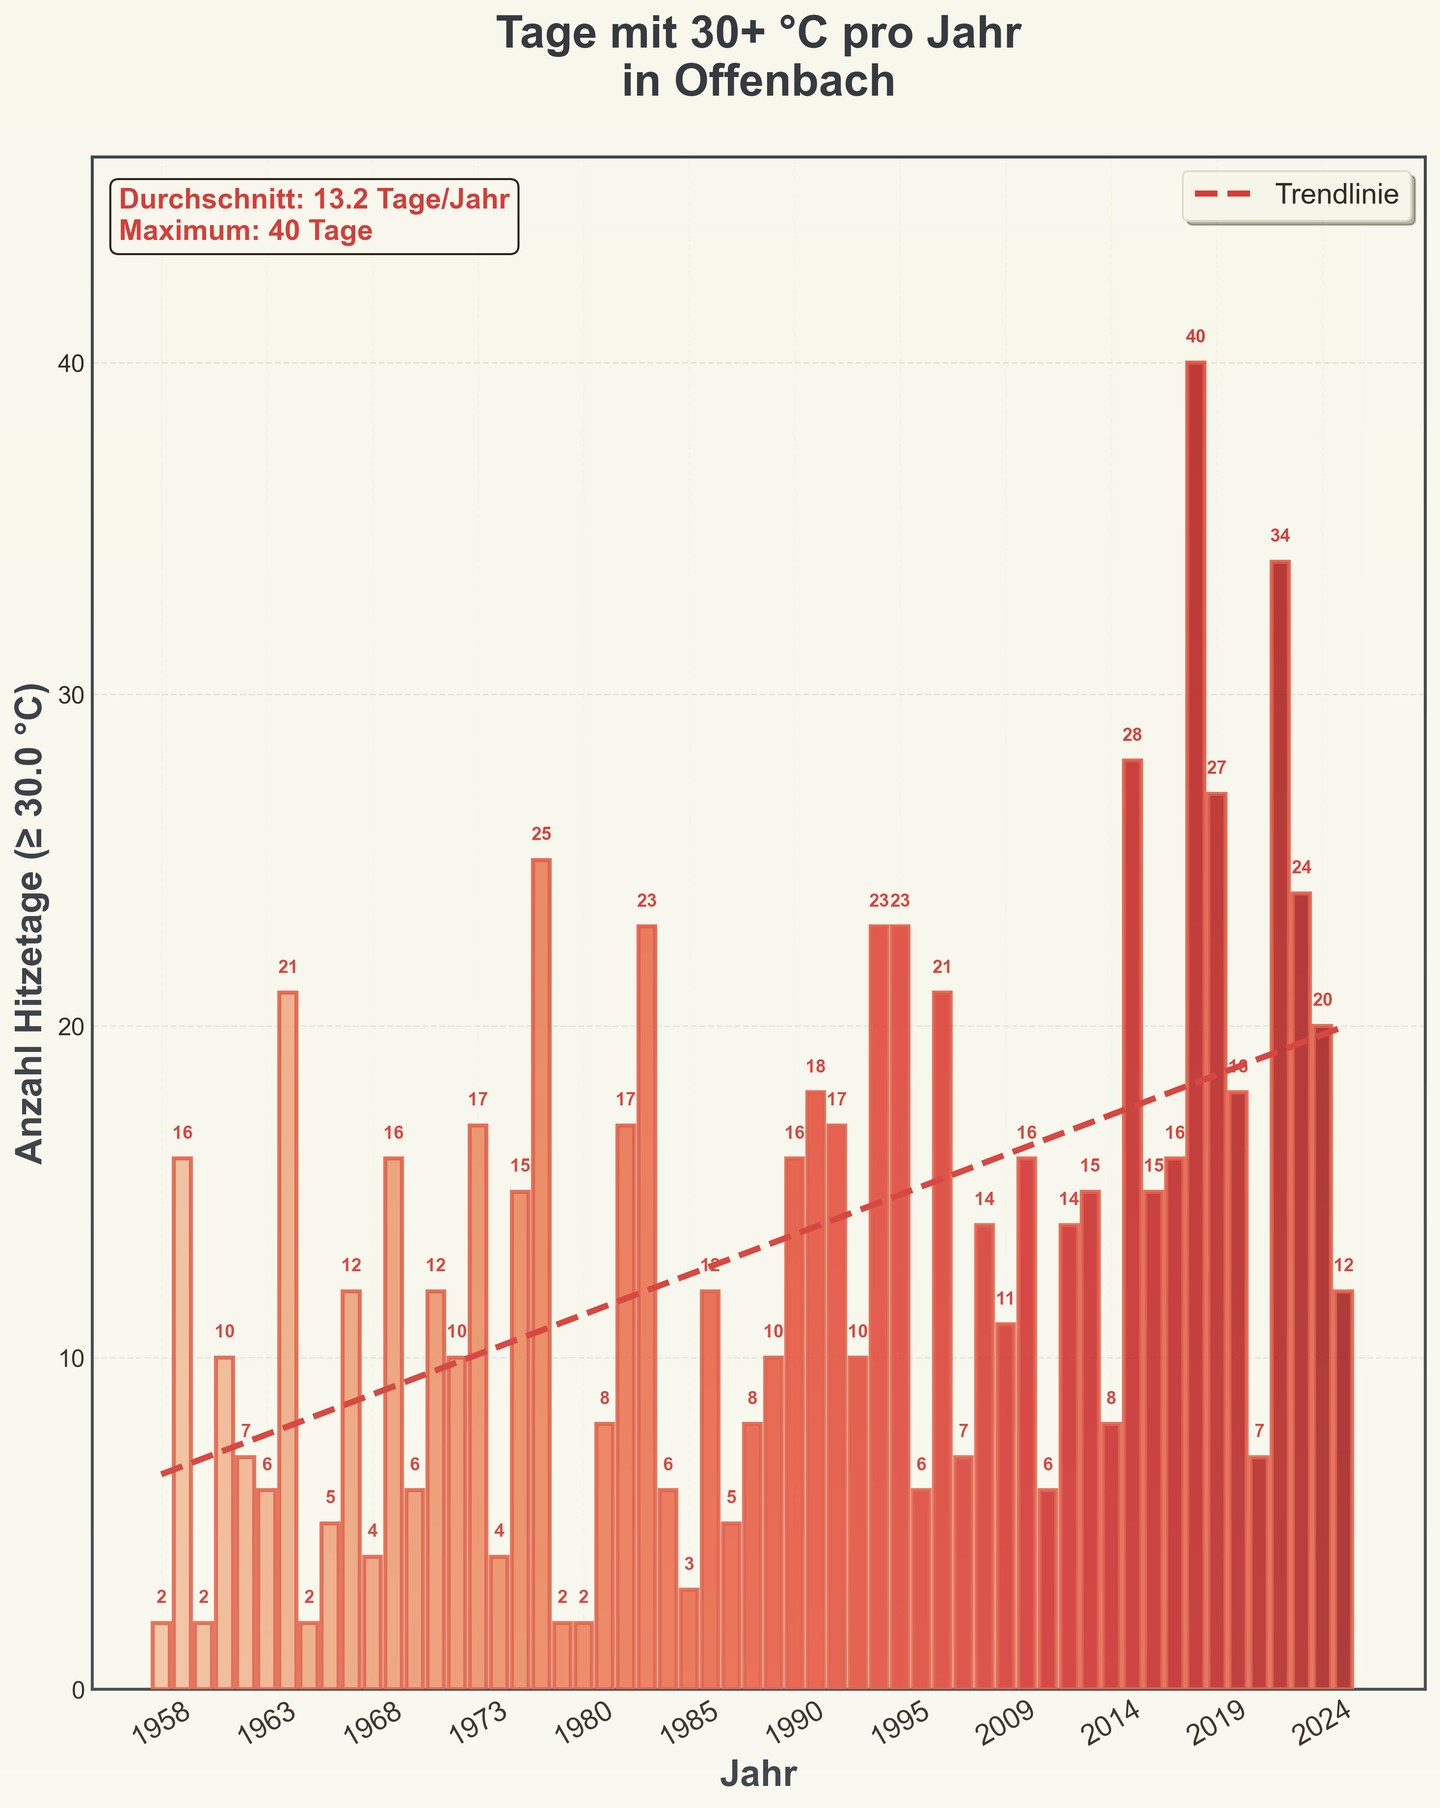
The second chart counts hot days (daily max >= 30°C) per year. Record: 40 hot days in 2018. The year 1958 had just 2.
There’s a data gap from roughly 1995 to 2005 – no measurements are available for that period. The analysis combines records from three DWD stations in Offenbach (IDs 03776, 03775, 07341).
Code
DWD daily climate files (Offenbach stations 03776, 03775, 07341) are loaded, then:
June temperature trend — GAM via pygam for a smooth non-linear fit:
from pygam import LinearGAM, s
import pandas as pd
import numpy as np

# df from DWD produkt_klima_tag_*.txt, columns: MESS_DATUM, MONAT, JAHR, TXK (max temp)
df_monthly = df[df["MONAT"] == 6].groupby("JAHR")["TXK"].mean()
x = df_monthly.index.values.reshape(-1, 1)
y = df_monthly.values

gam = LinearGAM(s(0, n_splines=5)).fit(x, y)
y_pred = gam.predict(np.sort(x, axis=0))
# conf_interval = gam.confidence_intervals(x_sorted, width=0.95)
Hot days per year (≥30°C):
df_hot = df[df["TXK"] >= 30].groupby("JAHR").size()
Data: DWD Climate Data Center. Full script: hot_days.py.